The True Cost of Passive E-commerce: A CFO’s Guide
What “doing nothing” actually costs — and what the numbers say about intervention.
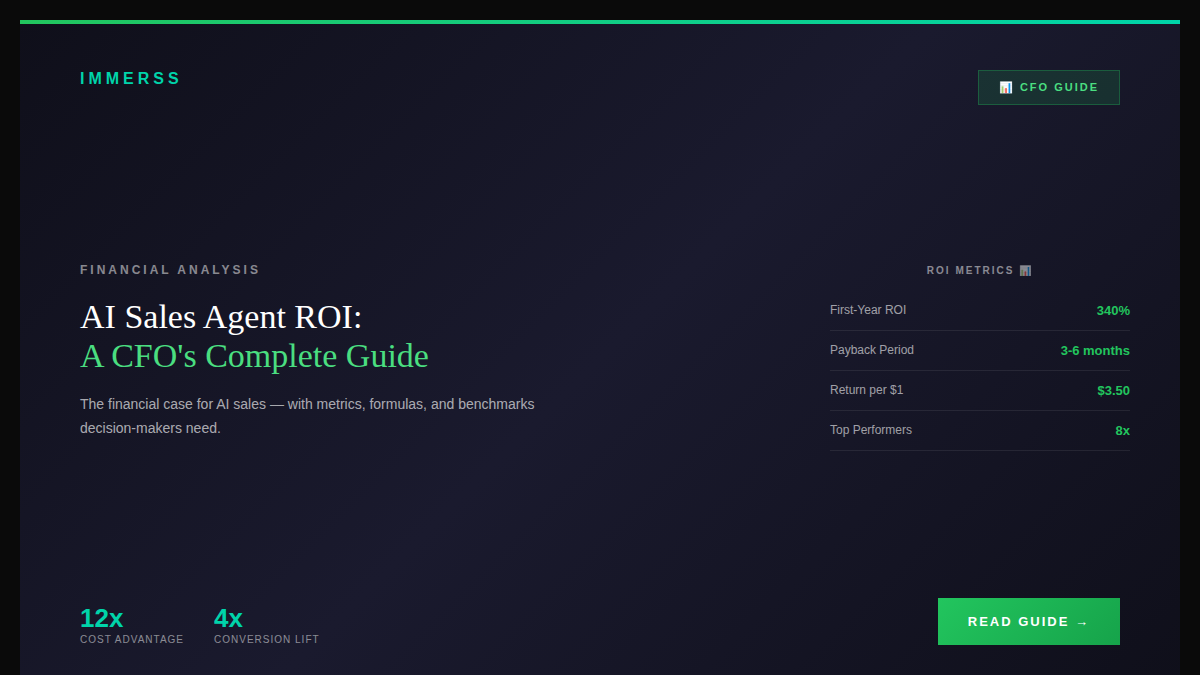
Executive Summary
Passive e-commerce — the model of displaying products and waiting for customers to buy — has quantifiable costs that most businesses never calculate. With average conversion rates of 2-3%, cart abandonment at 70%+, and customer acquisition costs up 40% since 2023, the gap between traffic potential and actual revenue is widening. This guide breaks down the true cost of passive approaches and the documented ROI of active engagement through AI Sales Agents.
Key insight: The cost of passive e-commerce isn’t implementation difficulty or budget constraints. It’s the revenue walking out the door every day while product grids wait silently for customers who never convert.
The Passive Model Defined
Passive e-commerce operates on a simple assumption: build a product catalog, display it online, and customers will browse, decide, and purchase independently.
This model made sense when digital commerce was novel. Product pages and shopping carts were revolutionary compared to mail-order catalogs.
But the model has fundamental limitations:
- No mechanism to answer real-time questions
- No guidance through complex purchase decisions
- No intervention when customers hesitate
- No coverage outside business hours
- No personalization beyond basic recommendations
These limitations have quantifiable costs.
The Conversion Reality
Average e-commerce conversion rates tell the story:
Global average: 2-3% (2025 data)
By category:
- Food & beverage: 6%+ (highest)
- Health & beauty: 2.5%
- Fashion: 3%
- Electronics: 1.6%
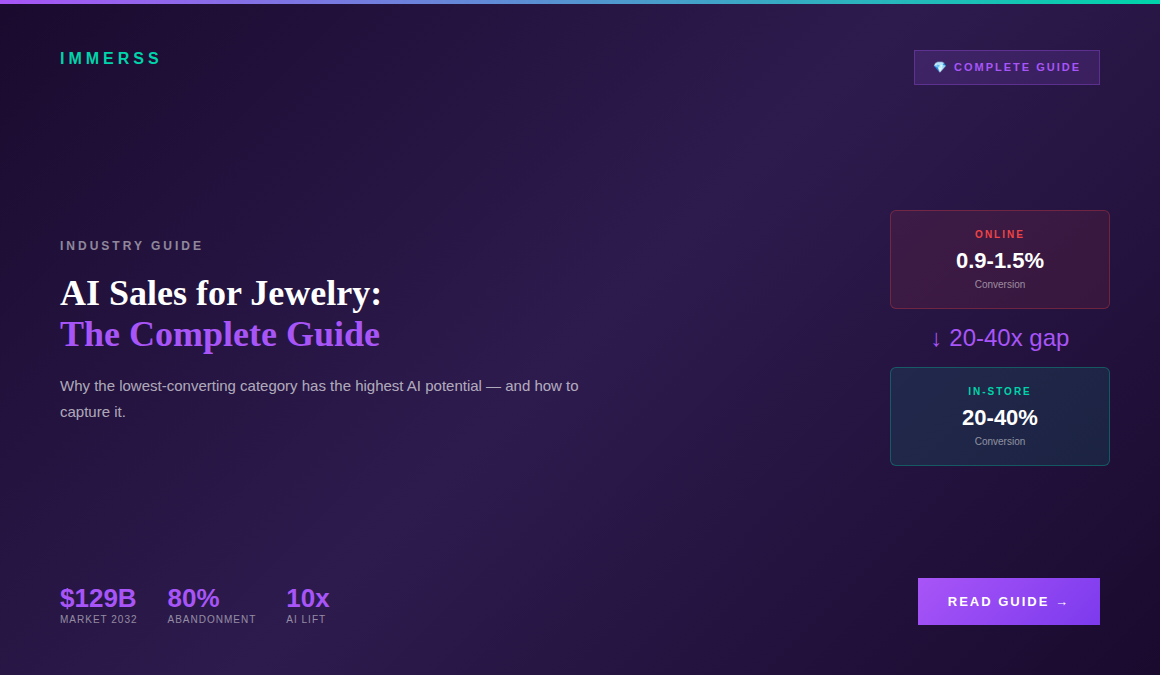
- Luxury & jewelry: 0.9-1.5% (lowest)
By device:
- Desktop: 3.2%
- Mobile: 2.8%
Translation: For every 100 visitors, 97+ leave without purchasing.
The passive model treats this as acceptable baseline performance. Active engagement treats it as opportunity.
The Cart Abandonment Cost
Cart abandonment represents the clearest cost of passive e-commerce — customers who selected products, demonstrated purchase intent, and then left.
Global abandonment rate: 70-77%
Mobile abandonment: 78-85%
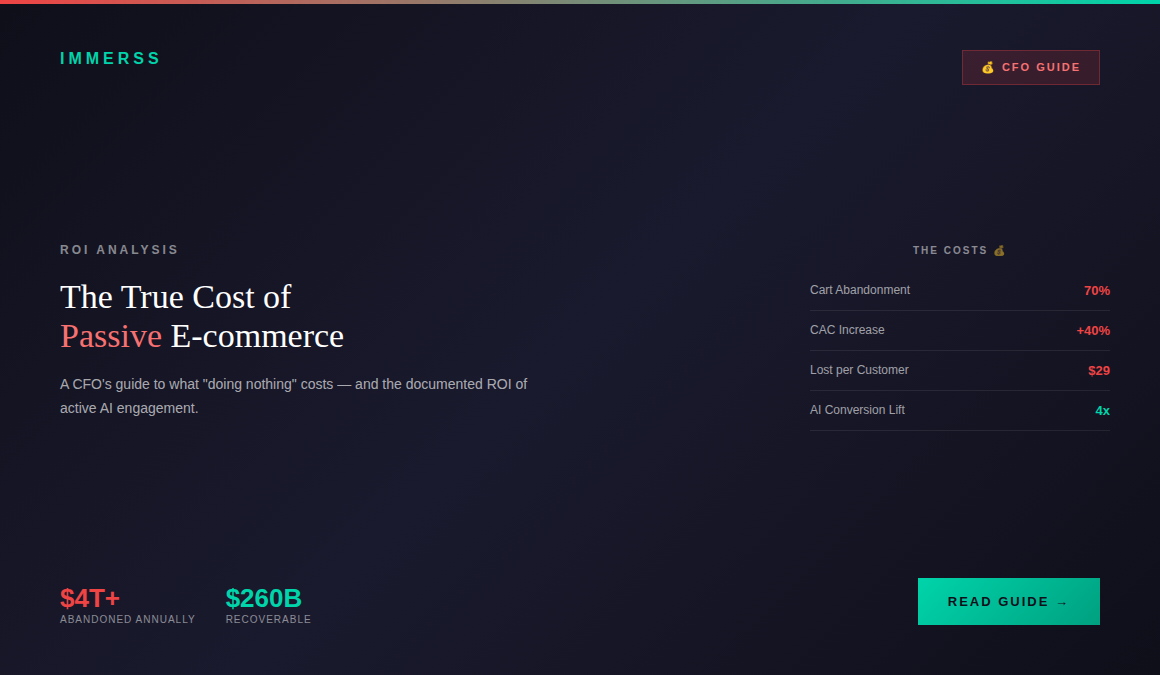
Annual value of abandoned merchandise: $4+ trillion
Recoverable portion: $260 billion
Average retailer loss: $417,815 over six months
Why they abandon:
- 48% unexpected costs (shipping, taxes, fees)
- 22% checkout too long/complicated
- 17% website errors
- 13% payment trust concerns
- 13% poor return policy
The common thread: unresolved questions and concerns at critical moments.
Passive sites offer no mechanism for real-time resolution. Customers encounter friction, can’t get help, and leave.
The Rising Cost of Traffic
What makes passive e-commerce increasingly expensive: traffic costs keep rising while conversion rates stay flat.
Customer acquisition cost (CAC) trends:
- Up 40% from 2023 to 2025
- Average CAC: $68-78 (varies by industry)
- Fashion CAC: $129
- Luxury CAC: $175+
Advertising cost inflation:
- Meta CPM: $10.88 (all-time high, +19.2% YoY)
- Google Ads CPC: +12.88% overall
- Shopping ads: +33.72%
- Beauty category: +60.11%
The compounding problem:
- E-commerce brands now lose $29 per new customer on average (vs $9 in 2013)
- That’s a 222% increase in acquisition losses
Same conversion rate with higher costs = declining profitability.
The Hidden Costs
Beyond direct conversion losses, passive e-commerce has hidden costs:
Off-Hours Revenue Loss
30-40% of e-commerce traffic arrives outside business hours — evenings, weekends, holidays.
Passive sites offer no assistance during these high-intent moments.
At 100,000 monthly visitors with 35% off-hours traffic:
- 35,000 unassisted visitors
- At 2.5% potential conversion and $150 AOV: $131,250/month in vulnerable revenue
Return Rate Differential
Without consultation, customers buy uncertain. Uncertainty creates returns.
Online return rates: 20-30% In-store return rates: 6%
The gap: 3-5x higher returns online.
For a retailer doing $300K monthly:
- At 25% return rate: $75,000 in returns
- At 15% return rate (with consultation): $45,000 in returns
- Monthly savings: $30,000
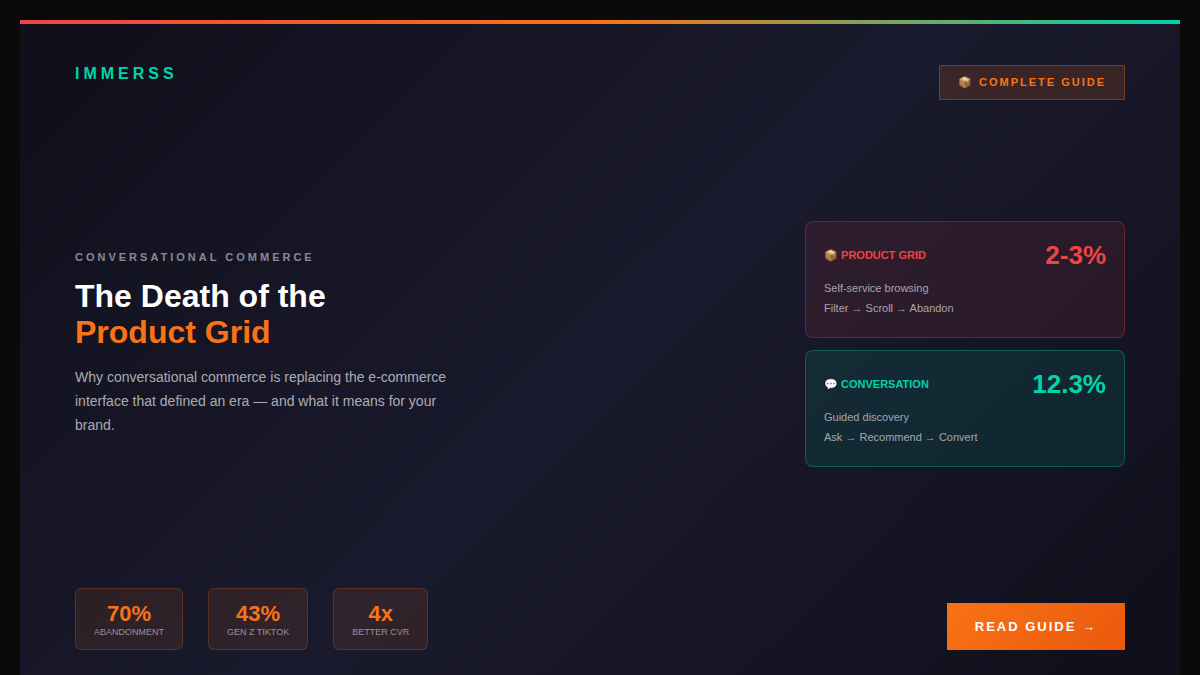
Cross-Sell and Upsell Losses
Without active engagement, customers buy the minimum — no styling suggestions, no complementary products, no complete solutions.
Research shows:
- Cross-selling generates 10-30% of e-commerce revenue
- AI-assisted customers spend 25% more (returning customers)
- Digital assistants contribute to upselling in 20% of cases
Passive sites forfeit this additional revenue entirely.
The Calculation: Passive vs. Active
Let’s model a typical mid-market retailer.
Current Passive State
Traffic & conversion:
- 100,000 monthly visitors
- 2.5% conversion rate
- 2,500 orders
- $120 AOV
- $300,000 gross monthly revenue
Costs:
- 25% return rate = $75,000
- $150,000 monthly CAC spend
- Net from new customers: $75,000
Lost revenue:
- 70% cart abandonment on remaining visitors
- Off-hours revenue vulnerable: $131,250
- Cross-sell/upsell opportunity: ~$45,000
With AI Sales Engagement
Traffic & conversion:
- 100,000 monthly visitors
- 30% engage with AI = 30,000 conversations
- AI-engaged visitors convert at a dramatically higher rate than baseline
- 5% of engaged convert = 1,500 additional orders
- Plus original baseline = 4,000 total orders
- $140 AOV (higher through consultation)
- $560,000 gross monthly revenue
Improved costs:
- 18% return rate (fit confidence) = $100,800
- Same CAC spend captures more value
- Cross-sell included in higher AOV
The Difference
Gross revenue: $560K vs $300K = +$260K Net of returns: $459K vs $225K = +$234K
Annual impact: $2.8M+ additional revenue from same traffic
Research Validation
The conversion impact of active engagement is well-documented:
AI chatbot performance:
- Increase orders by 26%
- 23% average conversion rate improvement
- Dramatically higher conversion among engaged visitors
Cart abandonment intervention:
- Proactive chat recovers 35% of abandonment
- Exit-intent offers significantly reduce bounce
- Abandoned cart emails: 41.8% open rate, 10.7% conversion
Checkout optimization:
- Better design increases conversion by 35.26% (Baymard Institute)
- One-page checkout: up to 21% better than standard
AOV improvement:
- Returning customers: +25% with AI chat
- Upselling in 20% of AI interactions
- BNPL options: +40% AOV improvement
The Time Cost
Beyond revenue, passive e-commerce costs operational time:
Customer service burden:
- Same pre-purchase questions answered repeatedly
- AI handles 80% of routine questions automatically
- Frees human agents for complex issues
Manual recovery:
- Email sequences chasing abandoned carts
- Real-time intervention beats after-the-fact follow-up
- Lower recovery rates at higher effort
Analysis paralysis:
- Trying to understand why customers leave
- Conversation data reveals intent and objections directly
- Actionable insights vs speculation
The Competitive Context
The most significant hidden cost: falling behind.
Current AI adoption:
- 97% of retailers plan to increase AI spending
- 54% already use AI for customer-facing roles
- 89% of retail/CPG companies using or piloting AI
- 33% of enterprise software will include agentic AI by 2028
What this means:
- AI engagement is becoming table stakes
- Competitors who implement capture share
- Passive approaches lose ground monthly
The window for competitive advantage is narrowing. Soon, AI engagement won’t be differentiating — it will be minimum expectation.
Implementation Economics
For decision-makers evaluating the investment:
Cost comparison:
- AI Sales Agent: Fraction of human headcount cost
- 24/7 coverage without overtime
- Scalable to traffic volume
- No training/turnover costs
Payback calculation:
- If AI recovers just 10% of cart abandonment
- On $417K average abandonment: $41,700 recovered
- Plus conversion lift, AOV increase, return reduction
- Typical ROI timeline: 60-90 days
Risk profile:
- Lower than hiring additional staff
- Lower than major platform migration
- Measurable impact from day one
- Easy to A/B test against baseline
The Immerss Approach
Immerss AI Sales Agents address each cost center:
Conversion optimization: AI engages visitors, answers questions, guides decisions — converting browsers into buyers.
Cart abandonment intervention: Proactive engagement when customers hesitate. Real-time objection handling versus email follow-up.
24/7 coverage: Every hour, every day, every time zone. No off-hours revenue loss.
Return reduction: Consultation builds confidence. Confident customers return less.
AOV improvement: Styling suggestions, complementary products, complete solutions through conversation.
Operational efficiency: Automated responses to routine questions. Human escalation for complex issues only.
The Decision Framework
For CFOs and decision-makers, the calculation is straightforward:
Current cost of passive:
- Lost conversions: quantifiable
- Cart abandonment: quantifiable
- Off-hours loss: quantifiable
- Return premium: quantifiable
- Cross-sell loss: quantifiable
Cost of active engagement:
- Implementation: known
- Monthly operation: known
- ROI timeline: measurable
Net equation: If cost of passive > cost of implementation + operation, active engagement is positive ROI.
For most retailers, the cost of passive exceeds implementation costs within the first month.
Next Steps
-
Calculate your passive cost: Traffic × (100% - conversion rate) × AOV = monthly unrealized potential
-
Identify your biggest leaks: Cart abandonment? Off-hours? Returns? Category-specific conversion gaps?
-
Model the intervention: What would 10% recovery of cart abandonment mean? 2x conversion among engaged visitors?
-
Evaluate implementation: Timeline, integration requirements, measurement approach
-
Test and measure: Pilot with A/B testing against baseline. Let data drive expansion.