Conversion & Retention Metrics: The Numbers That Actually Pay Your Bills
You’ve attracted the right traffic. Users engage with your content. They browse your products and add items to their carts.
But do they buy? And more importantly, do they come back?
Acquisition gets people to your store. Engagement keeps them browsing. But conversion and retention metrics determine whether your e-commerce business actually makes money.
This guide breaks down the seven critical metrics that directly impact your bottom line—and shows you exactly how to improve each one.
Why Most E-Commerce Brands Focus on the Wrong Revenue Metrics
Here’s the uncomfortable truth: you can have stellar traffic, impressive engagement, and still go bankrupt.
Revenue metrics are the only ones that matter when your rent is due.
The Common Mistake: Brands obsess over top-of-funnel metrics (traffic, followers, impressions) while neglecting bottom-of-funnel economics (conversion rates, customer lifetime value, acquisition cost).
The Result: They celebrate 100,000 monthly visitors while struggling to pay basic expenses because only 500 people actually buy anything.
Let’s fix that. These seven metrics tell you whether your business model actually works.
Conversion Metric #1: Conversion Rate (CVR)
Conversion rate is the percentage of site visitors who make a purchase. It’s your single most important metric because it directly measures how well you’re turning browsers into buyers.
How to Calculate Conversion Rate
CVR = (Number of people who purchase / Number of people who visited your website) × 100Example:
- 10,000 monthly visitors
- 250 purchases
- CVR = (250 / 10,000) × 100 = 2.5%
What’s a Good E-Commerce Conversion Rate?
According to industry leaders, average e-commerce conversion rates are 2.5% to 3% in 2024.
Performance Tiers:
- Below 1%: Critical problems
- 1-2%: Below average—significant optimization needed
- 2-3%: Average—room for improvement
- 3-5%: Good—above average performance
- 5%+: Excellent—best-in-class
But conversion rates vary dramatically by:
| Factor | Impact on CVR |
|---|---|
| Product price | Higher price = lower CVR |
| Product type | Impulse vs. considered purchase |
| Traffic source | Organic typically converts better than social |
| Device | Desktop usually converts higher than mobile |
| New vs. returning | Returning visitors convert 2-3x better |
The Two-Part Approach to Improving Conversion Rate
Part 1: Find Where People Leave
Using Analytics:
- Google Analytics: Behavior → Site Content → Exit Pages
- Contentsquare Web Analytics: Journey analysis tools
Common Exit Points:
- Product pages (high price concern or poor product info)
- Cart page (unexpected shipping costs, unclear process)
- Shipping information page (form too complex)
- Payment page (security concerns, limited payment options)
Part 2: Understand Why People Leave
Analytics show WHERE. Qualitative research shows WHY.
Methods:
- Exit-intent surveys asking “What prevented you from purchasing?”
- Session recordings showing actual user behavior
- Heatmaps revealing what users click (and don’t click)
- Customer interviews with those who abandoned carts
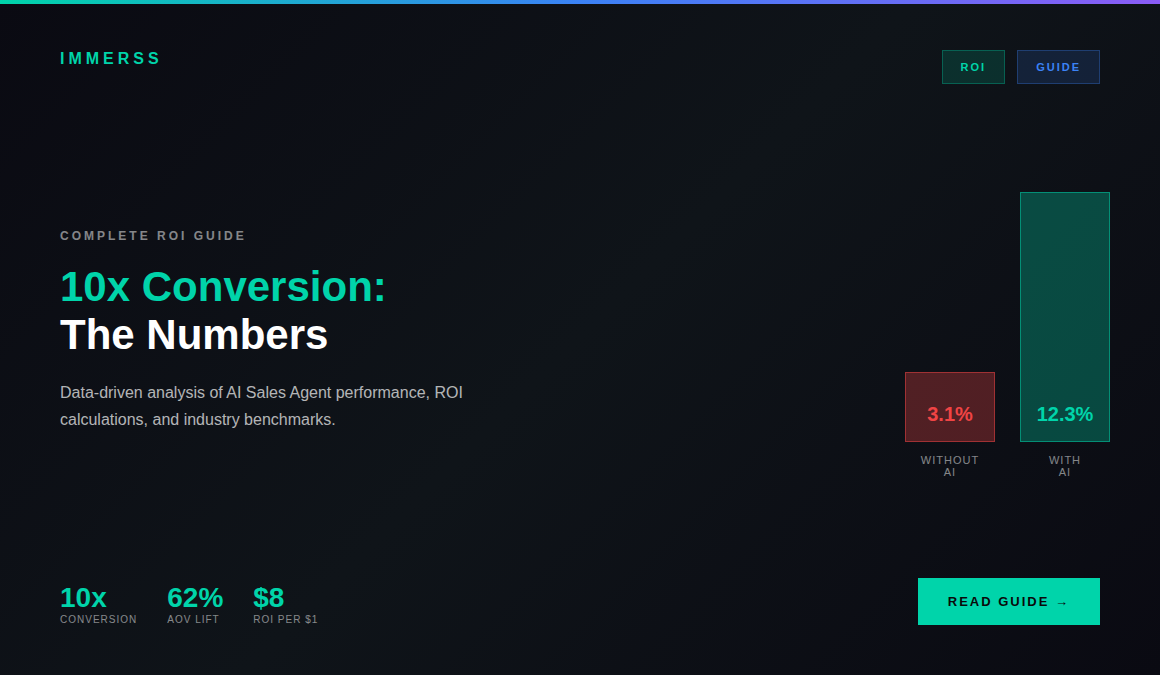
For High-Consideration Items: The gap between browsing and buying can be massive. For luxury products like jewelry, watches, or high-end fashion, conversion rates under 1% are common for standard e-commerce.
The Solution: Live video consultations can bridge this gap, increasing conversion rates to 40-60% for qualified leads by providing real-time product demonstrations, answering specific questions, and building trust through human interaction.
Quick Wins to Boost Conversion Rate
1. Simplify Checkout
- Reduce form fields to absolute minimum
- Offer guest checkout option
- Display security badges prominently
- Show progress indicators (Step 1 of 3)
2. Add Trust Signals
- Customer reviews on product pages
- Trust badges (SSL, payment security)
- Clear return policy
- Money-back guarantees
3. Reduce Cart Abandonment
- Show all costs upfront (no surprise shipping fees)
- Offer multiple payment options
- Enable cart saving for later
- Send abandoned cart emails (1 hour, 24 hours, 3 days)
4. Optimize for Mobile
- Thumb-friendly buttons and links
- Simplified mobile checkout
- Mobile payment options (Apple Pay, Google Pay)
- Fast loading on 3G/4G
Conversion Metric #2: Average Order Value (AOV)
Average order value is the average amount customers spend per purchase. Increasing AOV directly increases revenue without needing more traffic.
How to Calculate Average Order Value
AOV = Total revenue / Total number of ordersExample:
- Monthly revenue: $50,000
- Total orders: 400
- AOV = $50,000 / 400 = $125
What’s a Good Average Order Value?
Your AOV benchmark depends entirely on your products and pricing strategy. What matters is understanding how to systematically increase it.
AOV by Industry (Approximate):
- Fashion & apparel: $75-125
- Electronics: $150-300
- Home & garden: $100-200
- Jewelry: $150-500+
- Luxury goods: $500-2,000+
Proven Strategies to Increase AOV
1. Product Bundling
The Psychology: Bundles feel like better value, even when they’re not.
Examples:
- “Complete the look” sets
- Starter packs or kits
- Gift sets
- Buy one, get one at 50% off
The Math:
- Before: Customer buys single item at $50
- After: Customer buys bundle of 3 items at $120
- AOV increase: 140%
2. Tiered Free Shipping
The Strategy: “Free shipping on orders over $X”
The Psychology: Customers add items to qualify for free shipping, increasing order value.
The Sweet Spot: Set threshold 20-30% above current AOV.
Example:
- Current AOV: $75
- Set free shipping at $100
- Result: Customers add $25-30 in items to qualify
3. Strategic Upsells and Cross-Sells
Upselling: Upgrade to premium version
- “Best Seller” or “Most Popular” badges
- “Customers who bought this also chose…” (higher-priced item)
Cross-Selling: Complementary products
- “Frequently bought together”
- “Complete your purchase with…”
For Luxury E-Commerce: Live video consultations naturally increase AOV by allowing experts to suggest complementary items in real-time. Jewelry retailers using this approach report 25-35% higher AOV compared to standard e-commerce.
4. Volume Discounts
- Buy 2, save 10%
- Buy 3, save 15%
- Buy more, save more tier pricing
5. Limited-Time Offers
Creates Urgency:
- “Add $X more and get 20% off your entire order”
- “Spend $100 in the next hour for bonus gift”
Conversion Metric #3: Customer Lifetime Value (CLV or LTV)
Customer lifetime value is how much the average customer spends during their entire relationship with you. It’s crucial for determining sustainable customer acquisition costs.
How to Calculate Customer Lifetime Value
CLV = Average order value × Number of annual purchases × Average customer relationship (in years)Example:
- AOV: $100
- Purchases per year: 3
- Relationship length: 4 years
- CLV = $100 × 3 × 4 = $1,200
Why CLV Matters More Than You Think
Acquisition Cost Context: If your CLV is $1,200 and your customer acquisition cost is $50, you can afford aggressive marketing because you make 24x your investment.
If your CLV is $120 and your CAC is $50, your margins are razor-thin and scaling is nearly impossible.
Strategic Planning:
- Product development (what keeps customers returning?)
- Pricing strategy (can you afford to lose money on first purchase?)
- Marketing budget (how much can you spend to acquire a customer?)
How to Increase Customer Lifetime Value
1. Improve Product Quality
Obvious but critical. Great products create repeat customers.
2. Exceptional Customer Service
Statistics:
- 86% of buyers will pay more for better customer experience
- 73% of customers stay loyal because of friendly customer service
Actions:
- Fast response times
- Easy returns
- Proactive communication
- Go above and beyond
3. Email Marketing Sequences
Post-Purchase Sequence:
- Thank you email (immediate)
- Product care tips (3 days)
- Complementary product suggestions (7 days)
- Replenishment reminder (30-60 days)
- Loyalty program invitation (90 days)
4. Loyalty Programs
Effective Elements:
- Points for purchases
- Early access to sales
- Exclusive products
- Birthday rewards
- Referral bonuses
5. Personalization
Based on Purchase History:
- Personalized product recommendations
- Customized email content
- Targeted promotions
- Remember preferences
Conversion Metric #4: Customer Acquisition Cost (CAC)
Customer acquisition cost is how much you spend to acquire a customer—including all sales and marketing expenses.
How to Calculate Customer Acquisition Cost
CAC = Total marketing and sales expenses / Number of new customers acquiredExample:
- Monthly marketing spend: $10,000
- New customers: 200
- CAC = $10,000 / 200 = $50
What’s a Good Customer Acquisition Cost?
The Golden Rule: CAC should be at most 1/3 of CLV for healthy unit economics.
Example:
- CLV: $600
- Maximum sustainable CAC: $200
- Actual CAC: $150
- Margin for error/profit: $450
Industry Benchmarks (Approximate):
- Fashion/apparel: $10-50
- Home goods: $30-80
- Electronics: $50-150
- Jewelry/luxury: $75-250+
Reducing Customer Acquisition Cost
1. Improve Conversion Rate
The Math:
- Current: $10,000 spend, 2% CVR, 200 customers = $50 CAC
- Improved: $10,000 spend, 3% CVR, 300 customers = $33.33 CAC
Conversion rate improvements directly reduce CAC.
2. Optimize Traffic Sources
Channel CAC Analysis:
| Channel | Traffic Cost | Conversions | CAC |
|---|---|---|---|
| Organic Search | $0 | 50 | $0 |
| Email Marketing | $500 | 40 | $12.50 |
| Paid Search | $3,000 | 60 | $50 |
| Social Ads | $4,000 | 40 | $100 |
Action: Invest more in email, reduce social ads.
3. Leverage Organic Channels
- SEO for long-term traffic
- Content marketing for authority
- Social media (organic) for engagement
- Referral programs for word-of-mouth
4. Retargeting
The Power: People who’ve visited once are 70% more likely to convert than new visitors—and retargeting costs 2-10x less than cold acquisition.
Retention Metric #1: Shopping Cart Abandonment Rate
Shopping cart abandonment rate is the percentage of shoppers who add products to their cart but don’t complete the purchase.
How to Calculate Cart Abandonment Rate
Cart Abandonment Rate = 1 − (Number of completed orders / Number of orders initiated) × 100Example:
- 1,000 people initiated checkout
- 300 completed purchase
- Cart abandonment = 1 − (300 / 1,000) × 100 = 70%
What’s a Good Cart Abandonment Rate?
Nearly 70% of online shoppers abandon their carts—yes, it’s that high industry-wide.
Performance Tiers:
- Below 60%: Excellent
- 60-70%: Good
- 70-80%: Average
- Above 80%: Serious problems
Why Do People Abandon Carts?
Top Reasons (Research-Backed):
- Unexpected shipping costs (55%)
- Required account creation (34%)
- Complicated checkout process (26%)
- Couldn’t see total cost upfront (24%)
- Website errors/crashes (20%)
- Didn’t trust site with payment info (18%)
- Delivery too slow (16%)
Reducing Cart Abandonment
1. Show All Costs Early
Best Practice: Display shipping costs before checkout, ideally on product pages.
2. Offer Guest Checkout
Don’t force account creation. Let people buy first, create account after.
3. Simplify the Process
- Single-page checkout if possible
- Autofill capabilities
- Clear progress indicators
- Minimal form fields
4. Add Trust Signals
- SSL certificates visibly displayed
- Accepted payment method logos
- Security badges (Norton, McAfee)
- Guarantees and return policy links
5. Cart Abandonment Emails
Timing:
- 1 hour: “Did you forget something?”
- 24 hours: “Still interested? Here’s your cart”
- 3 days: “Last chance” with potential discount
Effectiveness: 45% open rates, 10-15% conversion rates
Retention Metric #2: Net Promoter Score (NPS)
Net Promoter Score monitors long-term customer loyalty through a simple question:
“On a scale of 1-10, how likely are you to recommend us to a friend or colleague?”
How Scoring Works
- 0-6 = Detractors (unhappy customers)
- 7-8 = Passives (satisfied but not enthusiastic)
- 9-10 = Promoters (brand advocates)
How to Calculate NPS
NPS = % Promoters − % DetractorsExample:
- 100 responses
- 60 promoters (60%)
- 25 passives (25%)
- 15 detractors (15%)
- NPS = 60 − 15 = +45
What’s a Good NPS Score?
Net Promoter Scores range from -100 to +100.
Benchmarks:
- Below 0: Crisis
- 0-30: Needs work
- 30-50: Good
- 50-70: Very good
- 70+: World-class
Industry Averages:
- E-commerce overall: 40-50
- Luxury retail: 50-60
- Fast fashion: 30-40
- Electronics: 35-45
The Hidden Gold in NPS: Passive Responses
Passives aren’t included in NPS calculation, but they’re your most important source of improvement insights.
Why? They’re satisfied enough to keep buying, but not thrilled enough to recommend. Understanding why reveals exactly what to improve to create promoters.
Action: Review all passive and detractor responses. Look for patterns. Fix the most common complaints.
Conclusion: Conversion and Retention Are Your Profit Engines
Traffic is expensive. Engagement takes effort. But conversion and retention directly determine profitability.
The Hierarchy of Revenue Growth:
Level 1: Get traffic (acquisition metrics) Level 2: Keep them engaged (engagement metrics) Level 3: Make them buy (conversion metrics) Level 4: Make them stay (retention metrics)
Each level builds on the previous. You can’t skip steps.
But here’s the secret: a 10% improvement in conversion rate has the same revenue impact as a 50% increase in traffic—and costs far less to achieve.
Focus on conversion and retention. Optimize relentlessly. Build a business that doesn’t just attract customers—it turns them into profitable, loyal advocates.
Revenue solves all problems. Track these metrics. Improve them systematically. Watch your business transform.