The Conversion Advantage: The Complete ROI Guide for AI Sales Agents
Data-driven analysis of AI Sales Agent performance metrics, ROI calculations, and benchmark comparisons across industries.
Executive Summary
AI Sales Agents deliver measurable improvements across all key e-commerce metrics. This guide provides a comprehensive analysis of conversion rate impact, Average Order Value (AOV) lift, Return on Investment (ROI) calculations, and industry benchmarks to help businesses evaluate and measure AI Sales Agent deployments.
Key findings:
- Dramatically higher conversion rates among visitors who engage with AI vs. passive browsers
- Meaningfully higher AOV demonstrated in luxury retail deployments
- $3.50–$8 ROI for every $1 invested (industry average)
- Weeks to positive ROI — not months or years
The E-Commerce Conversion Challenge
Industry Baseline
The average e-commerce conversion rate presents a significant opportunity gap:
| Metric | Value | Source |
|---|---|---|
| Global average conversion rate | 1.65–3.34% | IRP Commerce, Envive 2025 |
| Amazon Prime conversion rate | 10–13% | Industry benchmark |
| Top performer threshold | 4.7%+ | Envive 2025 |
Implication: 96–98% of visitors leave without purchasing.
The Engagement Gap
The core issue isn’t traffic — it’s engagement:
| Visitor Behavior | Percentage |
|---|---|
| Visitors who browse passively | 80–90% |
| Visitors who engage meaningfully | 10–20% |
| Visitors who initiate contact | <5% |
AI Sales Agents address this gap by proactively engaging visitors rather than waiting for them to ask for help.
How AI Sales Agents Improve Conversion
The Engagement Multiplier
AI Sales Agents increase the percentage of visitors who engage:
| Scenario | Engagement Rate | Change |
|---|---|---|
| Without AI (passive) | 5–10% | Baseline |
| With AI (proactive) | 20–30% | 3-4x increase |
This happens because:
- AI initiates conversation based on browsing behavior
- Engagement isn’t dependent on visitor action
- Relevant triggers (page views, time on site, exit intent) prompt interaction
The Conversion Multiplier
Among engaged visitors, AI dramatically improves conversion:
| Scenario | Conversion Rate | Source |
|---|---|---|
| Unassisted browsers | Baseline | Industry studies |
| AI-assisted shoppers | Dramatically higher | Industry studies |
| Improvement | Dramatically higher | — |
Combined Effect
The total conversion multiplier:
Higher engagement combined with higher conversion among engaged visitors compounds into a dramatically higher overall conversion rate
This illustrates why AI-engaged visitors convert at a dramatically higher rate than unassisted browsers — a comparison of engaged visitors versus passive browsers, not overall site conversion.
Benchmark Data: AI Impact on Conversion
Research-Backed Statistics
| Metric | Value | Source |
|---|---|---|
| Websites with AI chatbots see conversion increase | 23% | Industry study |
| Businesses reporting sales increase from chatbots | 67% | Master of Code |
| Chatbot conversion rates in optimal conditions | Up to 70% | Industry data |
| AI-driven personalization revenue lift | 40% | Industry data |
| Cart abandonment recovery rate | 15–25% | Industry average |
Speed Impact
AI accelerates the purchase journey:
| Metric | Value | Source |
|---|---|---|
| Purchases completed faster with AI | 47% | Rep AI |
| First response time reduction | 37% | Industry data |
| Query resolution within 11 messages | 90% | Tidio |
Immerss Performance: The Conversion Reality
Conversion Rate Impact
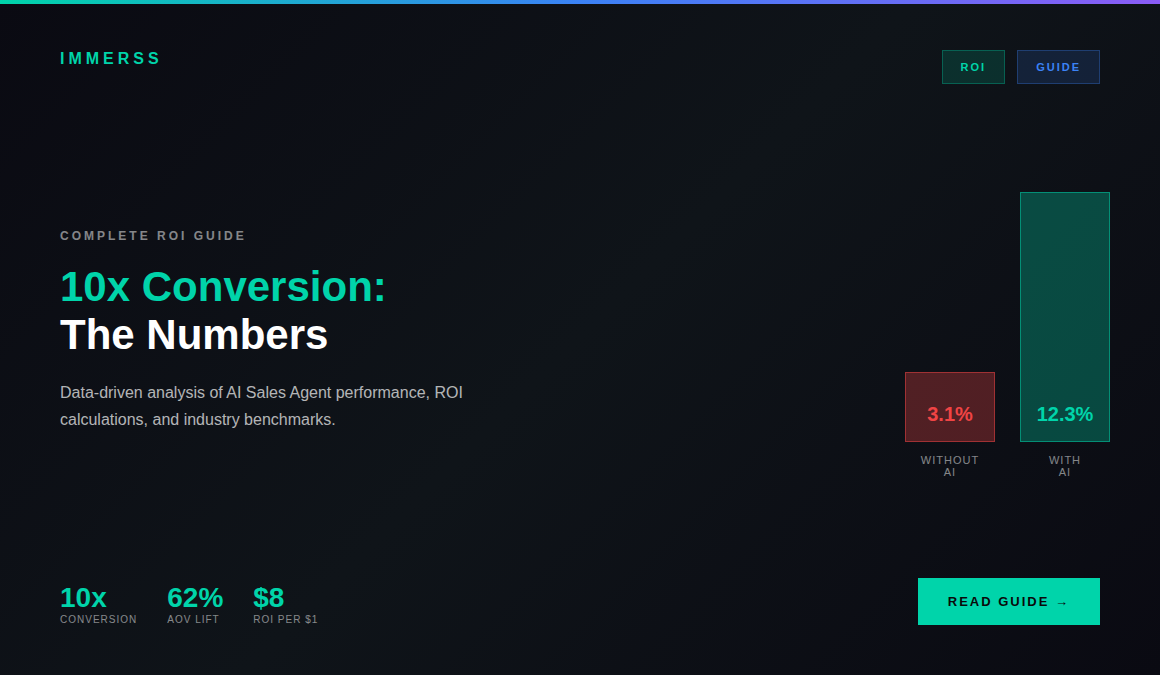
Immerss AI Sales Agents demonstrate dramatically higher conversion rates among engaged visitors compared to passive browsers.
This is measured by comparing:
- Visitors who interact with the AI Sales Agent
- Visitors who browse without engagement
The difference stems from:
- Proactive, personalized engagement
- Instant answers to product questions
- Real-time objection handling
- Guided path to checkout
AOV Impact: The Lucchese Case Study
Lucchese, a luxury boot brand, deployed Immerss AI Sales Agents with measurable results:
Meaningfully higher Average Order Value
Contributing factors:
- Personalized product recommendations
- Cross-sell and upsell suggestions
- Value articulation (craftsmanship, materials)
- Confidence building through guided selling
24/7 Coverage Impact
Stores capture materially more leads during off-hours with AI Sales Agent coverage (see: 24/7 Autonomous Selling guide).
ROI Calculation Framework
Key Metrics
| Metric | Definition | Typical Impact |
|---|---|---|
| AI Engagement Rate | % of visitors who interact with AI | 20–30% |
| AI Conversion Rate | % of engaged visitors who purchase | 10–15% |
| Conversion Lift | Improvement vs. non-engaged | dramatically higher |
| AOV Lift | Increase in average order value | Meaningfully larger |
| Revenue Attribution | Sales influenced by AI | Measurable |
ROI Formula
Monthly Revenue Impact =
  (Monthly Visitors × AI Engagement Rate × AI Conversion Rate × AOV)
  - (Monthly Visitors × Passive Engagement Rate × Passive Conversion Rate × Baseline AOV)
Example Calculation
Inputs:
| Metric | Value |
|---|---|
| Monthly visitors | 100,000 |
| Baseline conversion | 2% |
| Baseline AOV | $150 |
| Current monthly revenue | $300,000 |
With AI Sales Agent:
| Metric | Before | After |
|---|---|---|
| Visitors engaged | 5,000 (5%) | 25,000 (25%) |
| Conversion (engaged) | 4% | 12% |
| AOV | $150 | $185 (+23%) |
| Monthly orders | 200 (from engaged) + 1,800 (other) | 3,000 (from engaged) + 1,500 (other) |
| Monthly revenue | $300,000 | $832,500 |
| Revenue lift | — | +177% |
Industry-Specific Benchmarks
Conversion by Category
| Industry | Avg. Conv. Rate | Relative AI Opportunity |
|---|---|---|
| Jewelry & Watches | 0.9–1.3% | Highest — guided selling matters most |
| Luxury Fashion | 1.0–1.5% | Very high |
| Beauty & Cosmetics | 2.0–3.5% | Moderate |
| Home & Furniture | 1.2–2.0% | High |
| Food & Beverage | 4.0–6.6% | Lower |
| Consumer Electronics | 1.5–2.5% | Moderate |
Key insight: High-consideration categories (jewelry, luxury, furniture) see the largest relative improvement because guided selling matters most when customers have questions and concerns.
AOV by Category
| Industry | Avg. AOV | AI-Assisted AOV Opportunity |
|---|---|---|
| Jewelry & Watches | $350–$2,000+ | Meaningfully larger |
| Luxury Fashion | $200–$800 | Meaningfully larger |
| Beauty & Cosmetics | $50–$150 | Larger |
| Home & Furniture | $300–$2,000 | Meaningfully larger |
Industry ROI Benchmarks
General AI Chatbot ROI
| Metric | Value | Source |
|---|---|---|
| Average ROI | $3.50–$8 per $1 invested | Industry average |
| High performer ROI | 8x+ | Top quartile |
| Forrester TEI (3-year) | 270% ROI | Forrester |
| Time to positive ROI | Weeks to months | Typical |
Revenue Impact
| Metric | Value | Source |
|---|---|---|
| Annual revenue increase | 7–25% | Industry data |
| Cost reduction | Up to 30% | Operational savings |
| Support cost savings | $80B by 2026 | Global projection |
| Work hours saved | 2.5B globally (2024) | Industry estimate |
Implementation Guide
Phase 1: Baseline Measurement
Before deployment, establish baseline metrics:
| Metric | How to Measure |
|---|---|
| Current conversion rate | Orders / Visitors |
| Current AOV | Revenue / Orders |
| Engagement rate | Interactions / Visitors |
| Support volume | Tickets / Visitors |
Phase 2: Deployment
Immerss AI Sales Agent deployment:
- Platform integration — Connect to Shopify, Salesforce Commerce Cloud, Magento, WooCommerce, or custom platform
- Knowledge base setup — Configure product catalog, FAQs, policies
- Brand voice configuration — Define tone, style, personality
- Trigger configuration — Set engagement rules and behaviors
Phase 3: Measurement
Track AI-specific metrics:
| Metric | Target |
|---|---|
| AI engagement rate | 20%+ |
| AI-assisted conversion | 10%+ |
| Conversion lift vs. baseline | 3x+ |
| AOV lift | 20%+ |
Phase 4: Optimization
Continuous improvement:
- Review conversation analytics
- Identify high-converting patterns
- Refine product recommendations
- Update knowledge base
Cost Comparison
AI Sales Agent vs. Human Sales Team
| Cost Factor | Human Sales | AI Sales Agent |
|---|---|---|
| 24/7 coverage | 3+ FTEs required | Included |
| Scaling | Linear with headcount | Unlimited |
| Training | Ongoing cost | One-time setup |
| Turnover | 20–30% annual | None |
| Consistency | Variable | 100% |
| Cost per conversation | $5–$15 | Fraction |
Immerss Pricing
| Plan | Cost | Features |
|---|---|---|
| Free | $0 | Full functionality, limited volume |
| Paid | Scales with usage | Unlimited volume, advanced features |
| Enterprise | Custom | Full customization, dedicated support |
Free plan available forever — start with zero investment, scale as results justify.
Conclusion
The conversion advantage is grounded in measurable data:
The math:
- markedly more visitors engaged (proactive AI vs. passive browsing)
- dramatically higher conversion among engaged visitors
- Combined: a dramatically higher overall conversion rate from the same traffic
The results:
- Dramatically higher conversion rates (engaged vs. non-engaged)
- Meaningfully higher AOV (Lucchese case study)
- $3.50–$8 ROI per $1 invested
- Positive ROI in weeks
The opportunity:
- 96–98% of visitors currently leave without buying
- AI Sales Agents work on that untapped 96–98%
- Even modest improvement = massive revenue impact at scale