Introduction
Running an e-commerce business without benchmark context is like training for a marathon without knowing your split times. You know you’re moving, but you have no idea whether you’re on pace, falling behind, or setting yourself up for failure in the final miles.
The global e-commerce market generates approximately $6.86 trillion in 2025, with projections continuing upward. Within that vast ecosystem, performance varies enormously. Some retailers convert visitors at five times the rate of others selling similar products. Some acquire customers profitably while competitors hemorrhage money on every acquisition. The difference often isn’t product quality, pricing strategy, or market positioning — it’s operational understanding and systematic optimization.
This guide presents the benchmarks that matter in 2026, synthesized from multiple industry sources analyzing hundreds of millions of sessions across tens of thousands of stores. More importantly, it examines what these numbers actually mean, where the largest opportunities for improvement lie, and how the emerging AI-driven engagement gap is creating a new performance tier that traditional optimization cannot match.
The goal isn’t to provide targets for their own sake. Benchmarks serve best as diagnostic tools — revealing where you excel, where you lag, and where focused investment will generate the greatest returns.
Conversion Rate Benchmarks: The Foundation Metric
Global Averages
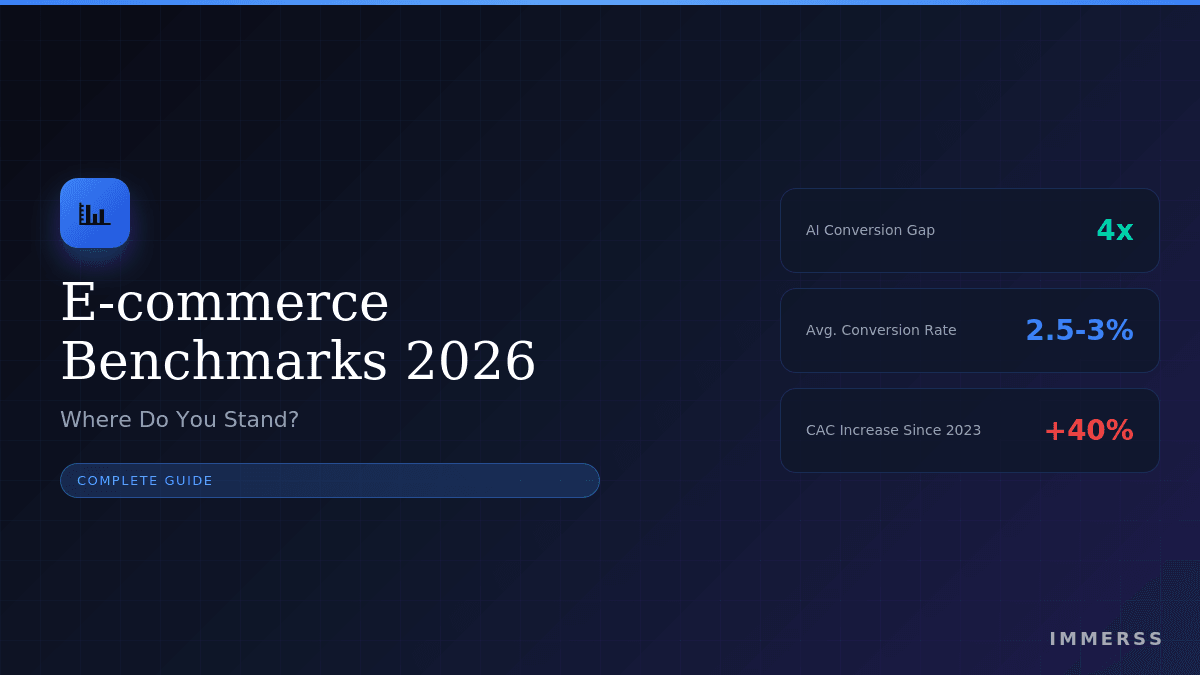
The global average e-commerce conversion rate sits between 2.5% and 3% as of late 2025. This represents a modest recovery from the 2.4% low point experienced in 2023, when economic uncertainty and rising advertising costs suppressed performance across the industry.
The recovery reflects several factors: widespread adoption of personalization tools, improved mobile checkout experiences, and the beginning of AI-powered engagement entering mainstream deployment. However, increased competition and continued advertising inflation mean merchants need higher conversion rates simply to maintain profitability relative to previous years.
Performance tiers:
- Top 10%: Above 4.7% conversion
- Top 20%: Above 3.2% conversion
- Median: 2.5-3.0% conversion
- Below median: Under 2.5% conversion
These aggregate numbers, however, obscure more than they reveal. The often-cited “average e-commerce conversion rate” of 2.5% to 3% is a blended number across every industry, traffic source, and store size. It’s about as useful as knowing the average temperature on Earth when you’re planning what to pack for a specific trip.
Conversion Rates by Industry
Industry vertical remains the single most important factor in determining what “good” looks like for your specific business. The variation between high and low-converting categories spans more than 5x.
Food & Beverage: 6.22% — The highest-converting category benefits from low-risk purchases, clear product understanding, and strong repeat purchase behavior. Customers buying specialty sauces, gourmet coffee, or subscription meal components face minimal purchase anxiety. They know what the product category does, they understand quality gradations, and the price points don’t require extended deliberation.
Beauty & Personal Care: 4-5% — Similar dynamics drive strong conversion: familiar product categories, manageable price points, and high repeat purchase rates. The combination of subscription models, sample programs, and influencer marketing creates multiple conversion pathways. Personal care purchases also benefit from routine replenishment needs that reduce decision friction.
Health & Wellness: 3-4% — Motivated by specific needs (fitness goals, health concerns, lifestyle changes), this category benefits from purpose-driven purchase intent. However, the consideration of ingredients, efficacy claims, and price comparison introduces some friction.
Retail & Ecommerce (General): 2.5-3% — The broad middle ground encompasses multi-category retailers where purchase intent varies significantly by product type. Performance depends heavily on category mix and merchandising effectiveness.
Fashion & Apparel: 2.5-3% — Fit uncertainty, style subjectivity, and size inconsistency across brands all suppress conversion. The 70%+ cart abandonment rate in fashion tells the story of customers who want products but don’t trust the purchase enough to complete it. High return rates (often 30-40%) reflect this fundamental uncertainty.
Home & Furniture: 1.4-1.7% — Large physical items requiring spatial planning and significant financial commitment naturally convert less frequently. Customers want to see, touch, and measure before purchasing furniture. The category benefits from room visualization tools and comprehensive product information, but inherent purchase complexity limits conversion.
Consumer Electronics: 1.5-1.6% — Technical specifications, compatibility concerns, and high price points create extended research cycles. Customers compare features across brands, read reviews extensively, and often wait for sales events. The considered purchase dynamic works against conversion.
Luxury Goods & Jewelry: 0.9-1.19% — The lowest-converting category faces unique challenges: extended consideration periods for major purchases, preference for in-store experiences, authentication concerns for high-value items, and the simple reality that spending $2,000+ on a watch requires absolute trust before transaction. However, the inverse relationship between conversion and AOV means luxury retailers can maintain healthy unit economics despite low conversion rates.
The Inverse Correlation Pattern
A critical insight emerges from this data: conversion rate correlates inversely with average order value and purchase complexity. Food and beverage leads at 6.22% because buying a $25 specialty sauce requires minimal research. Luxury jewelry converts at just 1.19% because customers research extensively before spending $2,000+ on a watch.
This pattern has practical implications:
-
Don’t compare yourself to wrong benchmarks. A 2% conversion rate is excellent for luxury watches but inadequate for consumable pet supplies.
-
Category benchmarks establish baselines, not ceilings. Top performers in every category significantly exceed these averages.
-
AOV and conversion rate must be optimized together. Increasing conversion through aggressive discounting may harm overall revenue if AOV declines proportionally.
The Device Performance Gap
Mobile vs. Desktop: A Persistent Divide
Despite years of mobile-first rhetoric and responsive design adoption, the performance gap between devices remains substantial.
Desktop Performance:
- Conversion rate: 3.9%
- Average order value: $146-204
- Share of traffic: ~25-30%
Mobile Performance:
- Conversion rate: 1.8%
- Average order value: $137-149
- Share of traffic: ~70-75%
Desktop converts at approximately 1.7x the rate of mobile. This gap has narrowed only marginally despite massive industry investment in mobile optimization.
Why the Gap Persists
The disparity isn’t explained by fundamentally different user intent. Mobile shoppers want to buy — they simply face more friction:
Screen size constraints make product evaluation more difficult. Images appear smaller. Product details require more scrolling. Comparison shopping between options becomes cumbersome. The physical limitation of small screens creates inherent disadvantage for considered purchases.
Checkout friction multiplies on mobile. Form fields that take seconds to complete on desktop become frustrating on touchscreens. Address entry, payment information, and account creation all require more effort. Each additional tap represents an opportunity for abandonment.
Environmental distractions compete for mobile attention. Desktop shopping typically happens with focused intent — sitting at a computer with time allocated for the task. Mobile shopping happens in line at the grocery store, during commercial breaks, and in other fragmented contexts where completing a purchase may be interrupted.
Load time sensitivity increases dramatically on mobile. Every additional second of delay costs approximately 7% of conversions. On mobile devices with variable network connectivity, slow-loading sites create immediate abandonment.
The Mobile Optimization Opportunity
If mobile brings 70% of your traffic but only accounts for 50% of your revenue, you’ve found a massive optimization opportunity. Closing even part of the device gap can be transformational.
Brands achieving 3%+ mobile conversion rates share common characteristics:
- Sub-three-second load times through image optimization, code minimization, and CDN deployment
- Digital wallet integration (Apple Pay, Google Pay, Shop Pay) eliminating manual payment entry
- Minimal form fields capturing only essential information
- Mobile-first design rather than responsive adaptations of desktop experiences
- Guest checkout options reducing account creation friction
- Clear trust signals visible without scrolling
- Thumb-friendly navigation with tap targets sized appropriately for touch
The benchmark guidance is clear: mobile optimization represents one of the largest available opportunities for most e-commerce retailers, and the gap between average and top performers is substantial.
Average Order Value Benchmarks
Global Overview
Global average order value reached approximately $150-180 in 2025, representing 5-8% growth over 2024. This growth reflects a combination of factors: inflation increasing product prices, improved upselling and cross-selling tactics, and evolving consumer behavior toward larger, consolidated purchases rather than multiple smaller transactions.
For direct-to-consumer brands specifically, Triple Whale data shows median AOV at $74.12 across paid advertising channels, representing 2.68% growth year-over-year. This lower figure reflects the methodology (paid traffic only) and the inclusion of smaller, newer stores in their dataset.
AOV by Industry
Industry variation follows predictable patterns tied to product pricing and purchase frequency:
Luxury & Jewelry: $349+ — The highest AOV category, with monthly peaks sometimes exceeding $400. High acquisition costs ($175+) become sustainable because transaction values match.
Home & Furniture: $253 — Elevated by high-ticket items and room package strategies. Retailers selling complete solutions rather than individual pieces achieve higher AOV.
Consumer Goods: $211 — Strategic bundling and bulk purchase incentives drive larger transactions.
Fashion & Apparel: $191-196 — Outfit completion strategies (styling suggestions, complementary accessories) elevate transaction values beyond single-item purchases.
Multi-brand Retail: $117 — The aggregator effect typically results in broader but shallower baskets.
Food & Beverage: $84 — Lower unit prices offset by subscription models and bundle offerings.
Beauty & Personal Care: $67-74 — High purchase frequency compensates for modest transaction sizes.
Pet Care: $68 — The lowest average AOV, though strong loyalty and predictable repurchase cycles create durable customer relationships.
AOV by Device
The device gap extends to order value:
Desktop: $146-230 AOV Mobile: $137-149 AOV Tablet: ~$154 AOV
The pattern reflects purchase type distribution. Considered purchases requiring detailed evaluation gravitate toward desktop, while mobile captures simpler, lower-value transactions. Complicated purchases — furniture sets, electronics, luxury items — are more likely to be completed on desktop where research and comparison are easier.
AOV by Region
Geographic variation reflects purchasing power and digital commerce maturity:
Americas: $176-183 average AOV EMEA: $173 average AOV APAC: $132 average AOV
North America leads due to higher purchasing power and mature e-commerce infrastructure. The differential has implications for international expansion — customer value varies by market in ways that affect acquisition investment thresholds.
Customer Acquisition Cost: The Rising Challenge
The Acquisition Crisis
Customer acquisition cost has increased approximately 40% between 2023 and 2026 across e-commerce. This escalation represents one of the most significant operational challenges facing online retailers.
Average e-commerce CAC: $50-130 depending on industry and channel mix
Key drivers of CAC increase:
- Increased platform competition for the same advertising inventory
- Privacy regulations (iOS changes, GDPR) reducing targeting precision
- Attribution challenges making optimization more difficult
- Major retailers (Temu, Shein) inflating auction costs
The Profitability Challenge
SimplicityDX research revealed a sobering reality: e-commerce brands now lose an average of $29 on every new customer they acquire when accounting for marketing costs and returns. The only path to profitability runs through repeat purchases, where profits average $39 per transaction.
In plain terms: the first sale is a loss leader. If your customers don’t return, you’re paying to lose money.
This dynamic fundamentally changes how acquisition should be evaluated. CAC matters only in relation to customer lifetime value generated. The essential benchmark is the LTV:CAC ratio — targeting 3:1 minimum (earning $3 for every $1 spent on acquisition), with 4:1 to 7:1 representing healthy performance for subscription and high-retention businesses.
CAC by Industry
Acquisition costs vary substantially by product category:
Food & Beverage: $15-35 — The lowest CAC category benefits from subscription models and natural repeat purchase behavior. Satisfied customers return regularly, reducing reacquisition needs.
Pet Products: $20-45 — Strong loyalty dynamics and predictable replenishment cycles create efficient acquisition economics.
Beauty & Skincare: $25-50 — Competitive paid social environment but strong repeat purchase behavior offsets higher acquisition costs.
Fashion: $30-80 — Wide variation depending on price point and positioning. Fast fashion achieves lower CAC through impulse purchase dynamics.
Consumer Electronics: $50-100 — Higher consideration periods and comparison shopping extend the acquisition funnel.
Luxury Goods: $175+ — The highest CAC category, justified by commensurately high AOV and the 5.2:1 LTV:CAC ratio these retailers typically achieve.
Platform Cost Trends
The major advertising platforms show consistent cost inflation:
Meta Advertising:
- Q1 2025 CPM: $10.88 (all-time high, +19.2% YoY)
- Q4 2025 CPM: $22.98 average
- Black Friday/Cyber Monday peak: $25.22
Google Ads:
- Average cost per lead: $70.11 (up 5.13% YoY)
- B2B paid search CAC: $802 average
Rising costs across platforms make channel diversification essential. Brands relying exclusively on paid media face structurally disadvantaged unit economics compared to those building organic channels (SEO, email, referral programs).
The Channel Efficiency Gap
Acquisition costs vary dramatically by channel:
Referral Programs: $141-200 CAC (B2B SaaS benchmark) — The most efficient channel leverages existing customer relationships and built-in trust.
Organic/SEO: $290-942 CAC fully loaded — Higher upfront investment but declining marginal costs as content compounds. Unlike paid channels, your 100th piece of content still generates customers from your first piece.
Paid Social (Facebook): ~$230 CAC — Platform of choice for many DTC brands but facing rising costs and attribution challenges post-iOS 14.
Paid Search: $802 CAC (B2B average) — High-intent traffic but increasingly competitive auction dynamics.
The strategic implication: Brands that invest in organic channels achieve dramatically lower blended CAC than those relying entirely on paid acquisition. A store running 60% of acquisition through email and organic search might report $22 blended CAC in the same niche where a paid-only competitor spends $75 per customer.
The AI Gap: The Largest Opportunity in 2026
The AI-Engagement Conversion Difference
The most significant benchmark shift in 2026 involves artificial intelligence adoption and its measurable impact on store performance.
AI-engaged visitors: dramatically higher conversion Self-serve browsing: typical baseline conversion
This dramatic difference represents the largest conversion opportunity currently available to most e-commerce retailers. It’s not a marginal improvement achievable through A/B testing button colors — it’s a categorical difference in store performance.
AI Adoption Has Reached Critical Mass
The experimental phase is over. AI deployment in e-commerce has become mainstream:
- 89% of retailers are actively using or assessing AI projects
- 77% of e-commerce professionals use AI daily in 2025 (up from 69% in 2024)
- 84% of e-commerce businesses consider AI their top strategic priority
- AI-enabled e-commerce market: $8.65 billion in 2025, projecting to $22.6 billion by 2032
The Traffic Transformation
Traffic from AI sources tells an even more striking story. Adobe Analytics reports that visits from generative AI sources to retail sites increased 4,700% year-over-year as of mid-2025.
During the 2025 holiday season, these AI-referred visitors demonstrated exceptional engagement:
- 31% higher conversion rates than traffic from traditional channels
- 254% increase in revenue per visit compared to the previous year
- 27% lower bounce rate than other traffic sources
- 32% longer visit duration indicating higher engagement
The pattern suggests AI-assisted shoppers arrive with clearer needs, better-informed expectations, and stronger purchase intent.
Measurable AI Impact on Key Metrics
The benchmark data shows AI affecting performance across multiple dimensions:
Conversion improvement:
- AI-powered personalization increases conversion rates by up to 23%
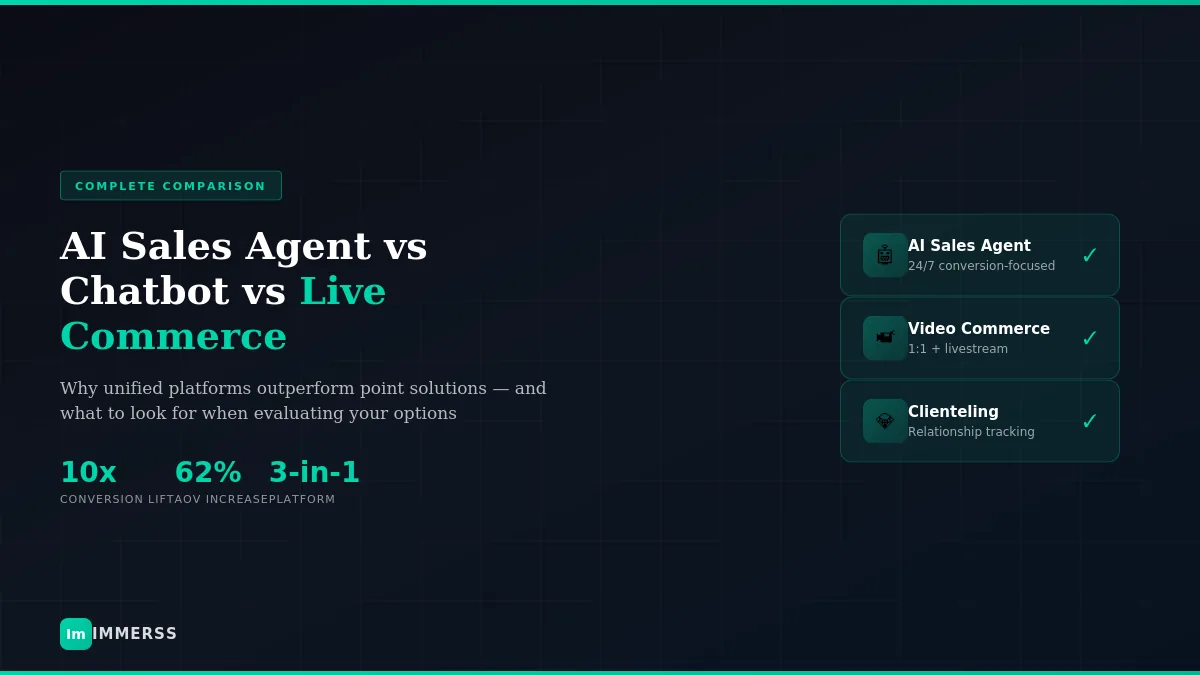
- Retail chatbots increase sales by 67% through improved product discovery
- 25% of retailers report increased conversion after implementing AI personalization
Speed and efficiency:
- Shoppers complete purchases markedly faster when assisted by AI
- 93% of customer questions are resolved by AI without human intervention
Revenue impact:
- Companies using AI personalization earn 40% more revenue than those without
- AI-powered sales generate 64% of revenue from first-time shoppers
- Product recommendations drive up to 31% of e-commerce site revenues
Cart recovery:
- Proactive AI chatbots recover a meaningful share of abandoned carts
- Sessions with recommendation engagement show meaningfully larger orders
Consumer Acceptance
The demand side supports AI adoption. Consumer readiness has advanced significantly:
- 87% of shoppers who have tried AI tools are excited about the positive impact on their shopping experiences
- 75% of consumers prefer AI chatbots to human agents for straightforward questions
- 34% of US customers express comfort letting AI shop for them
- 70% of consumers want features like virtual try-ons and voice search
The expectation gap is closing. Consumers increasingly expect personalized, AI-powered experiences — making such capabilities a baseline requirement rather than a competitive differentiator.
The Configuration Matters
Not all AI implementation delivers equal results. The conversion gap appears between well-configured AI sales engagement and passive self-serve browsing — not simply between having chatbots and not having them.
The distinction matters: support-oriented AI (reactive, ticket-focused, deflection-based) produces different results than sales-oriented AI (proactive, revenue-focused, engagement-driven). Configuration toward sales outcomes rather than support cost reduction drives the conversion differential.
Email Marketing Benchmarks
Channel Effectiveness
Email marketing continues delivering exceptional ROI — approximately $72 for every dollar spent in the US market (globally ~$36). The channel accounts for up to 40% of total e-commerce revenue for many online retailers.
Core Metrics
Open rates: 43.46% average in 2025 (up from 42.35% in 2024)
Click rates: 2.09% average (slight increase from 2024)
Click-to-open rates: 6.81% (up from 5.63% in 2024)
Unsubscribe rates: Averaging below 0.5% for well-maintained lists
Note: Apple Mail Privacy Protection now affects approximately 50-60% of recorded email opens, inflating open rate data. Savvy marketers increasingly prioritize click rates and conversion metrics over open rates as engagement indicators.
The Automation Revolution
The critical insight from 2026 email benchmarks involves the dramatic efficiency gap between campaigns and automated flows:
Campaigns: 94.7% of send volume, ~60% of email revenue Automated flows: 5.3% of send volume, ~41% of email revenue
Revenue per recipient for flows runs approximately 18x higher than campaigns. Automated emails generate $2.87 per email compared to $0.18 for campaigns.
This efficiency differential makes automation investment one of the highest-return opportunities in e-commerce marketing.
Flow-Specific Performance
Welcome emails: 83.6% open rate — Among the highest-performing automated sequences, critical for establishing customer relationships.
Abandoned cart emails: 50.5% open rate, 6.25% click rate, 3.33% conversion rate (top performers reach 7.69%). Recovery sequences capture significant revenue from high-intent shoppers who didn’t complete purchase.
Post-purchase emails: Strong engagement rates support review solicitation, cross-sell, and loyalty program enrollment.
Browse abandonment: Lower conversion than cart abandonment but higher volume, capturing interest earlier in the funnel.
Industry Variation
Email performance varies by sector:
Technology & Electronics: Highest click rate (~2.5%) — Clear value propositions and product-driven messaging encourage exploration.
Health & Wellness: Strong click rates (~1.9%) — Motivated audiences respond to educational and promotional content.
Fashion & Beauty: Lower click rates (1.4-1.5%) — High competition and frequent promotional emails can reduce engagement, making segmentation and personalization essential.
Cart Abandonment Benchmarks
The Persistent Challenge
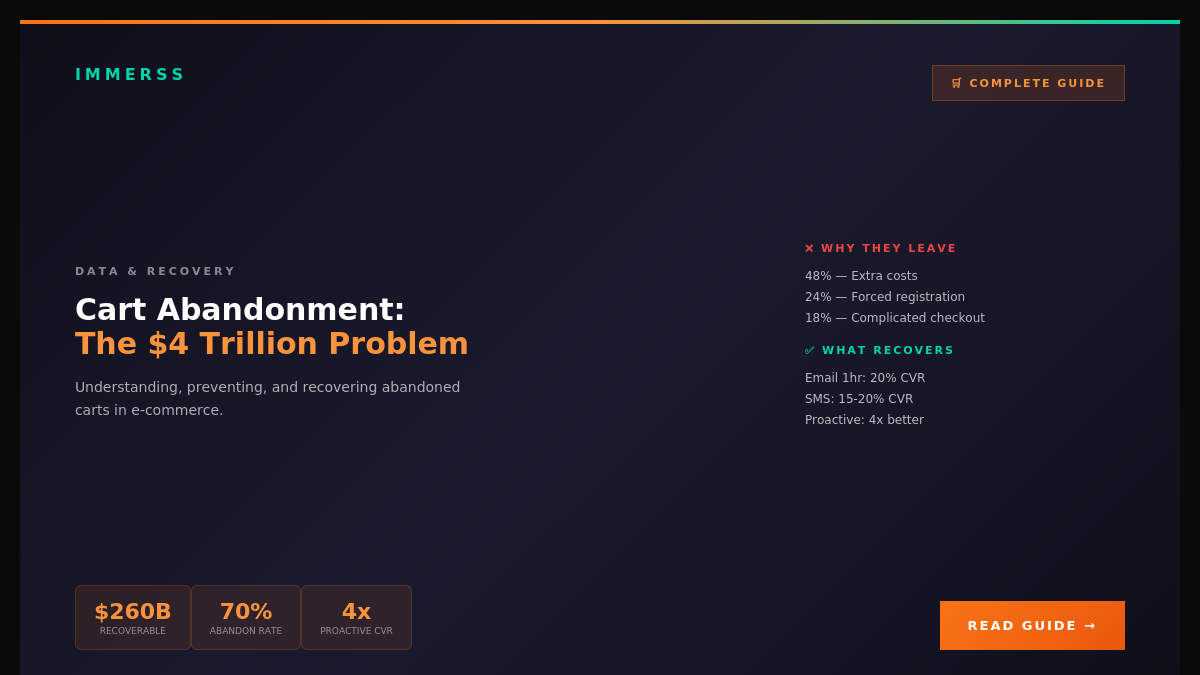
The global cart abandonment rate remains stubbornly fixed at approximately 70.19%, a number that has changed minimally despite years of optimization efforts across the industry.
By device:
- Mobile: 79-85% abandonment
- Desktop: 67-70% abandonment
The mobile abandonment gap reflects the same friction dynamics affecting mobile conversion: smaller screens, clunkier checkout processes, and more competing distractions.
Primary Abandonment Causes
Customer-reported reasons for cart abandonment have remained consistent:
-
Unexpected costs (48%) — Shipping, taxes, and fees revealed late in checkout create negative surprise and abandonment.
-
Account creation requirements — Forced registration adds friction that deters completion.
-
Complex checkout processes — Too many steps, too many form fields, unclear progress indicators.
-
Lack of trust signals — Missing security indicators, unclear return policies, unfamiliar payment processors.
-
Insufficient payment options — Limited payment methods exclude customers preferring specific options.
-
Delivery concerns — Unclear shipping times, expensive options, unavailable preferred methods.
Recovery Opportunities
The 70% abandonment rate represents captured intent — customers who demonstrated purchase interest before encountering friction. Recovery represents substantial revenue opportunity:
Email recovery:
- Abandoned cart emails achieve 41.8% open rates
- Conversion rate: 10.7% when deployed promptly (within 1 hour optimal)
- Best practice: 2-3 email sequence over 24-72 hours
AI recovery:
- Proactive AI chatbots recover a meaningful share of abandoned carts
- Real-time intervention during abandonment behavior more effective than post-abandonment email
Exit-intent offers:
- Displaying discount or free shipping when users attempt to leave
- Particularly effective on mobile where abandonment rates are highest
Prevention strategies:
- Transparent pricing earlier in funnel (shipping estimates on product pages)
- Guest checkout options
- Progress indicators during checkout
- Multiple payment options including digital wallets and BNPL
Traffic Source Benchmarks
Conversion by Traffic Source
Not all traffic converts equally. Channel mix optimization requires understanding source quality:
Direct traffic: 3.3% — The highest-converting source reflects high intent from visitors who typed your URL directly or accessed from bookmarks. These visitors already know your brand and have demonstrated previous interest.
Organic search: ~4% — Active searchers with specific product intent. The research mindset of search-driven traffic manifests in stronger conversion than passive discovery channels.
Email marketing: 2.8-10.3% — Wide range reflects segmentation sophistication. Behavioral triggers and personalized content drive the high end; batch-and-blast approaches drag down the average.
Paid search: 2-3% — High-intent traffic but dependent on keyword targeting and landing page alignment. Rising costs make efficiency management essential.
Referral: ~3% — Trust transfer from referring sources elevates conversion above cold traffic.
Paid social: 1-2% — Interruption-based discovery captures attention but requires nurturing for conversion.
Social media (organic): 0.91% — The lowest-converting source reflects browsing mindset. Social excels at awareness and discovery but struggles to convert the scrolling mentality into immediate purchases.
Strategic Implications
The conversion differentials between traffic sources have strategic implications:
-
Email deserves priority investment. The combination of high conversion rates and owned audience relationship makes email among the most valuable channels.
-
Organic search compounds over time. Unlike paid channels with recurring costs per visitor, SEO investment builds assets that continue generating traffic.
-
Social media requires funnel thinking. The 0.91% social conversion rate doesn’t make the channel worthless — it makes social a top-of-funnel awareness channel rather than direct conversion driver. Social’s role is filling the email list and creating retargeting audiences.
-
Direct traffic is earned, not bought. High-converting direct traffic results from brand building over time. It cannot be purchased but represents the outcome of other channel investments.
Putting Benchmarks Into Action
Diagnostic Framework
Benchmarks serve best as diagnostic tools rather than targets. Use this framework for interpretation:
Step 1: Establish appropriate comparisons. Compare your metrics to your specific industry, not global averages. A 2% conversion rate is excellent for luxury goods but concerning for consumable products.
Step 2: Identify largest gaps. Where does your performance fall furthest below category benchmarks? These gaps represent prioritized improvement opportunities.
Step 3: Quantify opportunity size. If your mobile conversion rate is 1.2% versus the 1.8% benchmark, calculate the revenue impact of closing that gap. Specific dollar values drive investment decisions better than percentage improvements.
Step 4: Assess improvement feasibility. Some gaps are easier to close than others. Mobile checkout optimization is more tractable than fundamentally changing your category’s consideration dynamics.
Priority Investment Areas for 2026
The benchmark data points toward clear priorities:
1. AI engagement (the largest opportunity)
The gap between AI-engaged and self-serve conversion represents the largest available opportunity. If you’re not using conversational AI for sales engagement, you’re competing with a structural disadvantage against retailers who are.
2. Mobile optimization (untapped traffic)
The persistent gap between mobile traffic share (70%+) and mobile revenue share indicates substantial untapped value. Sub-three-second load times, digital wallet integration, and mobile-designed checkout processes close this gap.
3. Email automation (18x efficiency)
Automated flows generating 41% of email revenue from 5.3% of sends represents one of the most efficient marketing investments available. Abandoned cart sequences, welcome flows, and post-purchase engagement should be table stakes.
4. Retention focus (margin driver)
When first-time customer acquisition averages a $29 loss, repeat purchase becomes the entire margin engine. Loyalty programs, subscription offerings, and personalized re-engagement justify investment as core revenue drivers.
5. Channel diversification (CAC management)
Rising paid media costs make organic channels increasingly valuable. Building SEO, email, and referral program capabilities reduces blended CAC and creates more sustainable unit economics.
Internal vs. External Benchmarks
External benchmarks provide context. Internal benchmarks drive action.
The most important metrics are your own trends:
- Is conversion rate improving quarter over quarter?
- Is AOV growing or stagnating?
- Are acquisition costs stabilizing or continuing to climb?
- Is customer retention improving?
A store improving from 1.5% to 2% conversion is making meaningful progress regardless of where the industry average sits. A store flat at 3% conversion while competitors improve is falling behind regardless of their position above the mean.
Conclusion
The benchmarks presented in this guide represent the current state of e-commerce performance in 2026 — but they represent floors rather than ceilings. Top performers in every category exceed these averages substantially, demonstrating that better results are achievable for stores willing to invest in systematic improvement.
Several themes emerge from the data:
The AI gap is transformational. A dramatic conversion difference between AI-engaged and self-serve visitors isn’t incremental — it’s categorical. Stores not deploying conversational AI for sales engagement are competing in a different league than those who are.
Mobile optimization remains underexploited. Despite years of mobile-first rhetoric, the device gap persists. The 70/50 mismatch (70% of traffic, 50% of revenue) represents substantial untapped value for most retailers.
Acquisition costs demand retention focus. When first purchases lose money on average, customer lifetime value becomes the entire margin story. Retention, repeat purchase, and customer relationship development are not secondary priorities — they’re the foundation of profitability.
Email automation delivers disproportionate returns. The 18x efficiency advantage of flows over campaigns makes automation investment among the highest-return opportunities in e-commerce marketing.
The question isn’t whether your store meets the benchmarks. The question is what the benchmarks reveal about where your next meaningful improvement will come from.
The gap between average and exceptional has never been wider in e-commerce. The stores that thrive recognize that these numbers provide diagnostic guidance for focused investment — not targets for their own sake, but signposts pointing toward the optimization opportunities that will define competitive advantage in 2026 and beyond.